The data available in the Government Digest of Statistics enables us to review over 20 years of revenue and spend by the public sector.
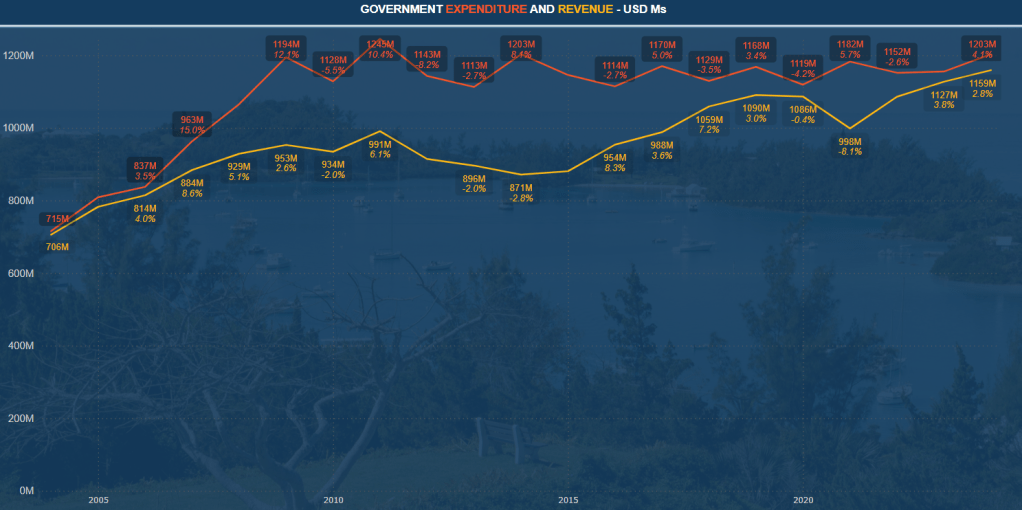
The most notable movement is from 2005 through 2009, when expenditure rose nearly 50% in just 4 years. These increases took several forms, including government wages and salaries rising from c. $300m to a peak of c. $415m in 2009, as well as significant capital expenditure which also peaked in 2009 at $200m.
Since 2010, expenditure has remained reasonably steady, though the share of spend has shifted heavily towards paying down the debt.
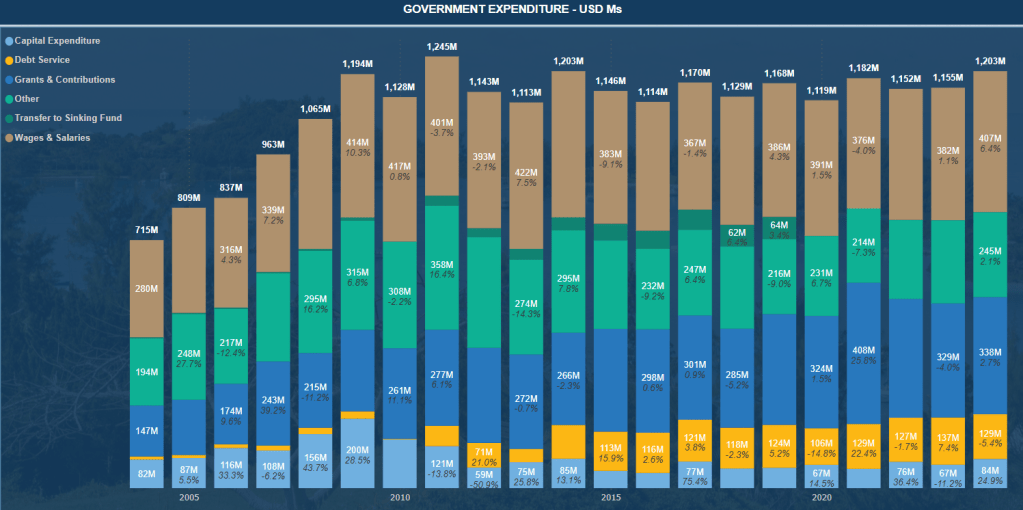
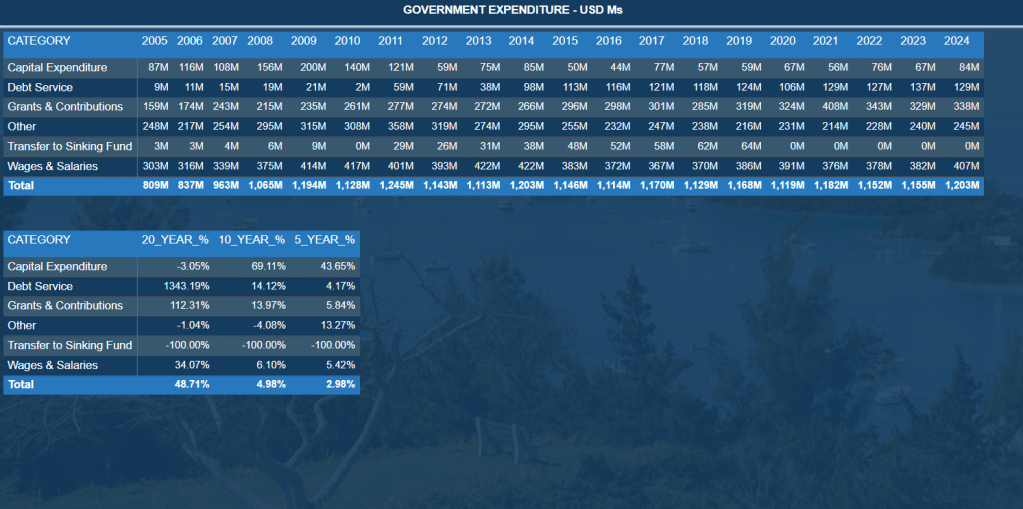
Over the last 20 years, debt servicing expense has risen over 1,300%, from under $10m per year to consistently near $130m per year.

This also results in most other areas of spend remaining fairly static. Over the last 10 years expenditure has only increased 5% – far less than inflation. And in the last 5 years only 3%. Wages in the public sector (as total expenditure) have only risen 6% in 10 years.

Leave a comment