Through presenting the total view of employment over time, it is easier to spot trends and insights into what is happening in Bermuda and her industries.
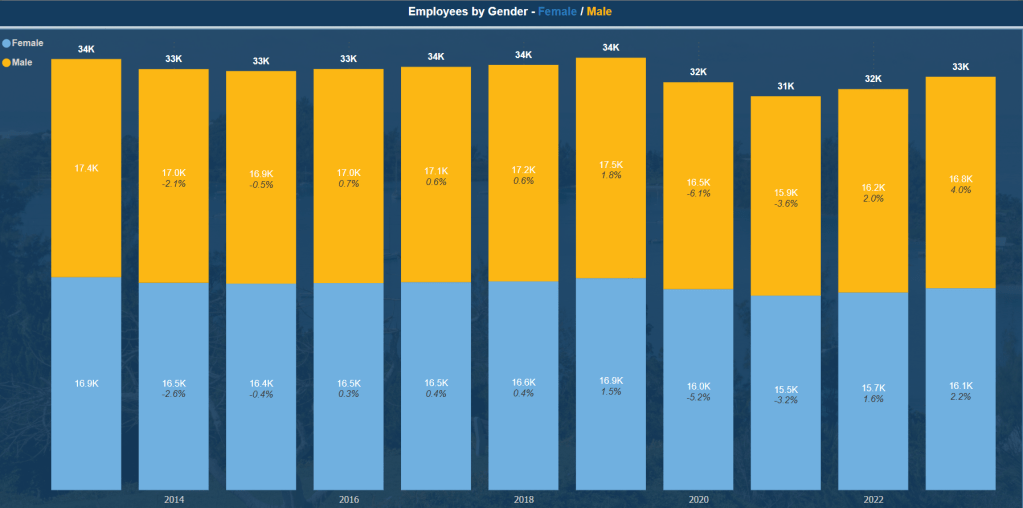
Employment was at 34,277 in 2013, before falling through 2015. This trend was curbed and employees rose through 2019, before a significant drop of 5.7%. Since then the recovery has been gradual, and remains 4.4% below 2019 as of 2023.

Since 2013, female employees have fallen some 5.2%, while males just 3.1%. The fall since 2019 is more balanced, with both falling between 4% and 5%.
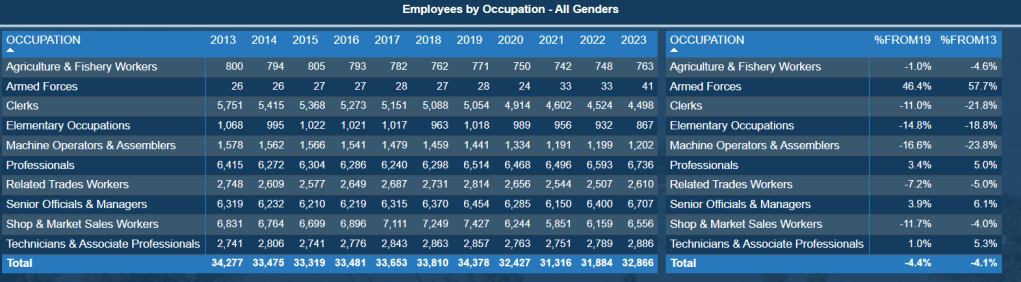
There has been an overall fall in employment since 2013 of 4.1%, with the main growth coming through ‘white-collar’ occupations such as Professionals and Senior Managers, and falls across the ‘blue-collar’ occupations. Notably, Clerks are down 22%, Elementary Occupations are down 19% and Machine Operators & Assemblers are down 24%. This dynamic has continued throughout the time period.
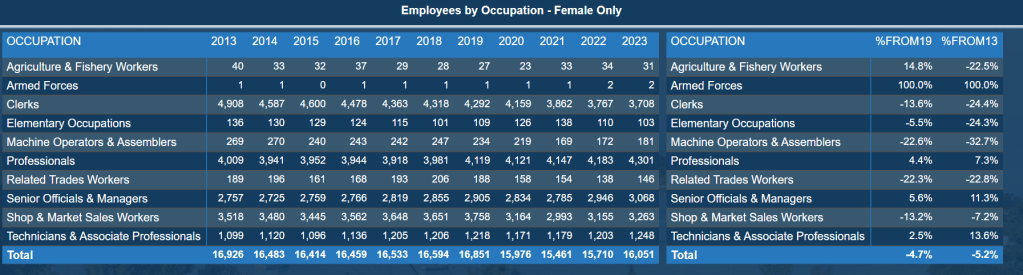
For females, the largest growth since 2013 has been in Technicians & Associate Professionals, growing 13.6% to 1,248 positions, and in Senior Officials & Managers, up some 11.3% to just over 3,000 positions. The largest fall has been in Clerks, down 1,200 jobs to 3,708. The highest occupation for females is Professionals, which has grown 7.3% since 2013.
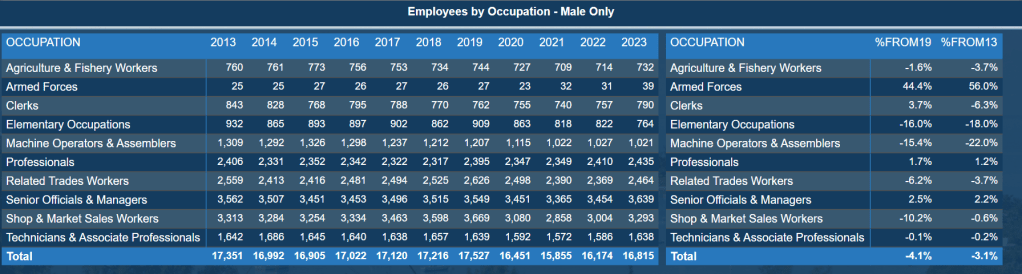
For males, positions have generally been more stable, with the highest growth in absolute terms being in Professionals and Senior Officials & Managers – combined adding some 120 positions. The largest decreases have been across Machine Operators & Assemblers, Elementary Occupations and Related Trade Workers. This shift speaks to the overall trends in the economy – with ‘blue collar’ jobs decreasing and ‘white collar’ jobs growing.
Source: Bermuda Labour Market Statistics. Click for more details on data source
