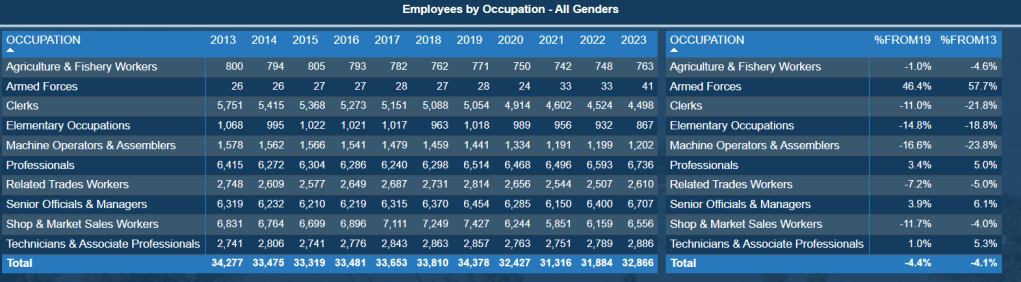
We have added the 2024 Labour Market Statistics, and updated the commentary accordingly. This has not changed the trends, as can be seen in the data. The breakdown of employees by status, occupation and gender over time yields several interesting trends and changes:
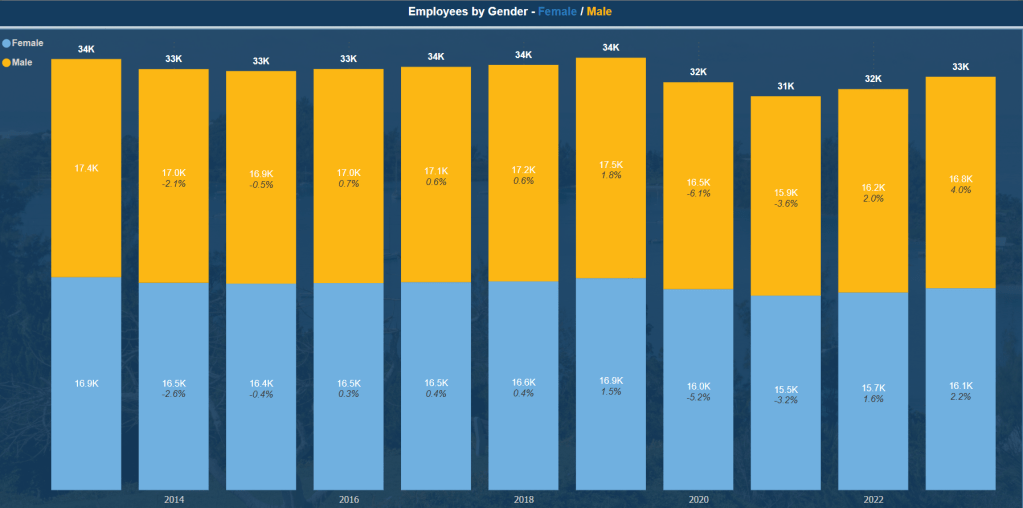
- The economy lost significant jobs during the Covid-19 outbreak in 2020, comparing the 2024 market to the last year before this (2019) is instructive
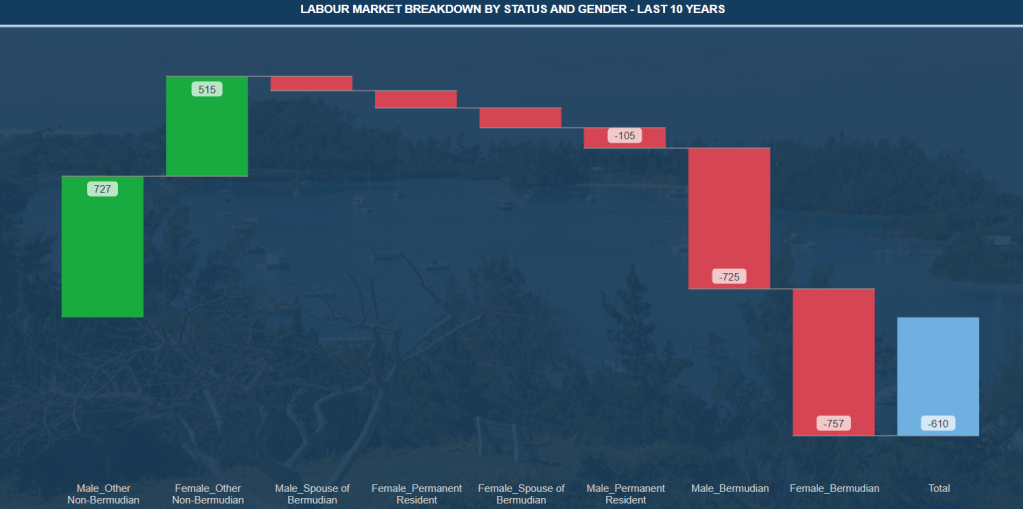
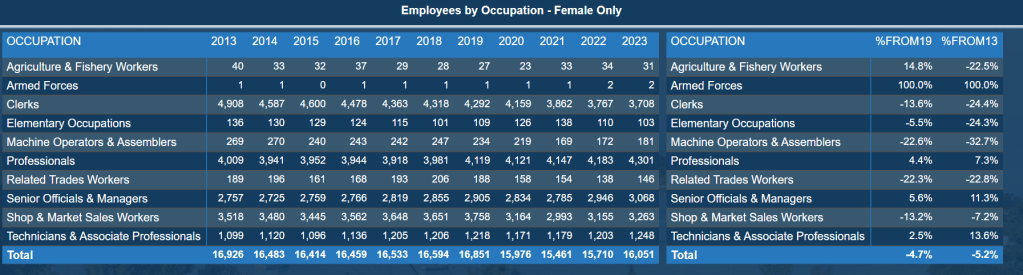
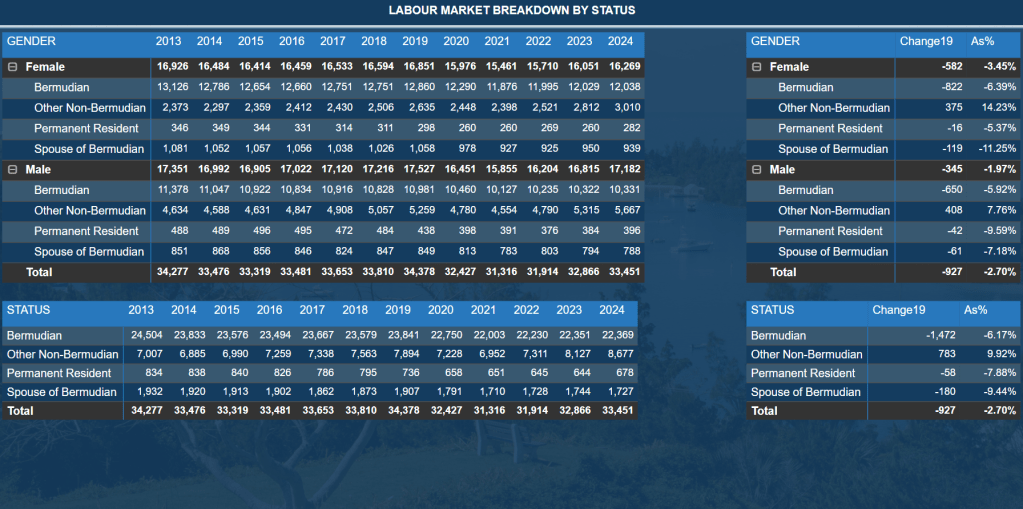
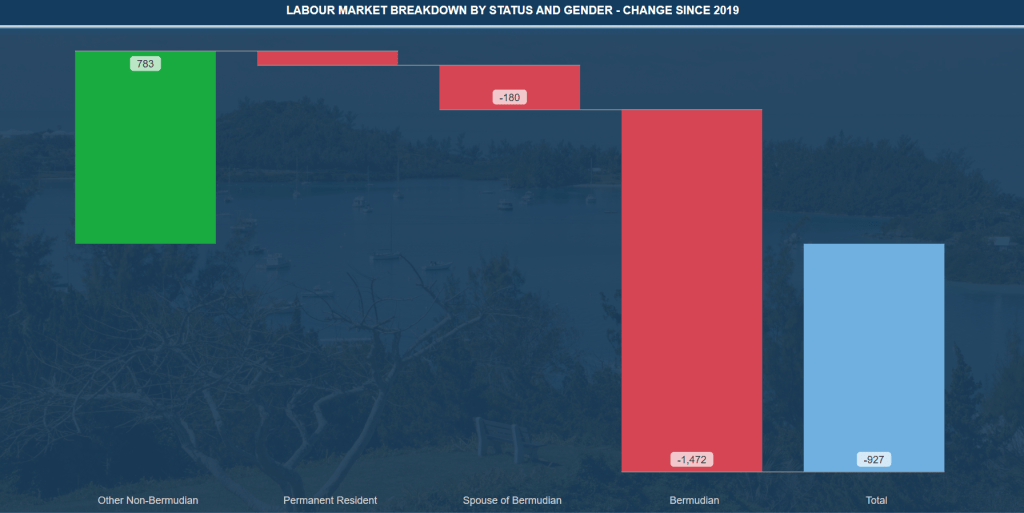
- Since 2019, there are almost 1,500 fewer positions filled by Bermudians, a 6% fall, with a greater fall among women
- Both PRC (-8%) and Spouses of Bermudians (-9%) also fell
- The overall reduction is just under 3%, or roughly 1,000 employees. The growth has exclusively come from Non-Bermudians, making up some 783 positions – a rise of 10% since 2019
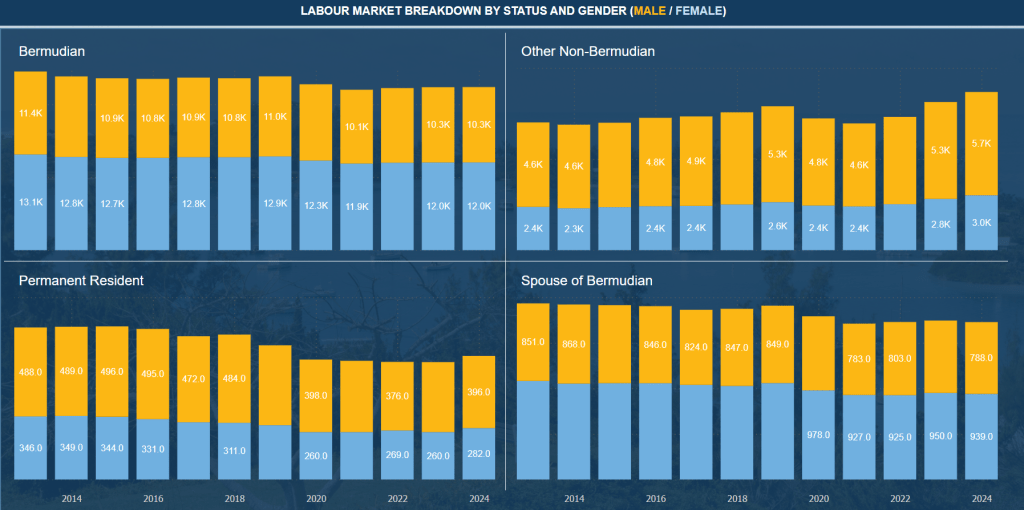
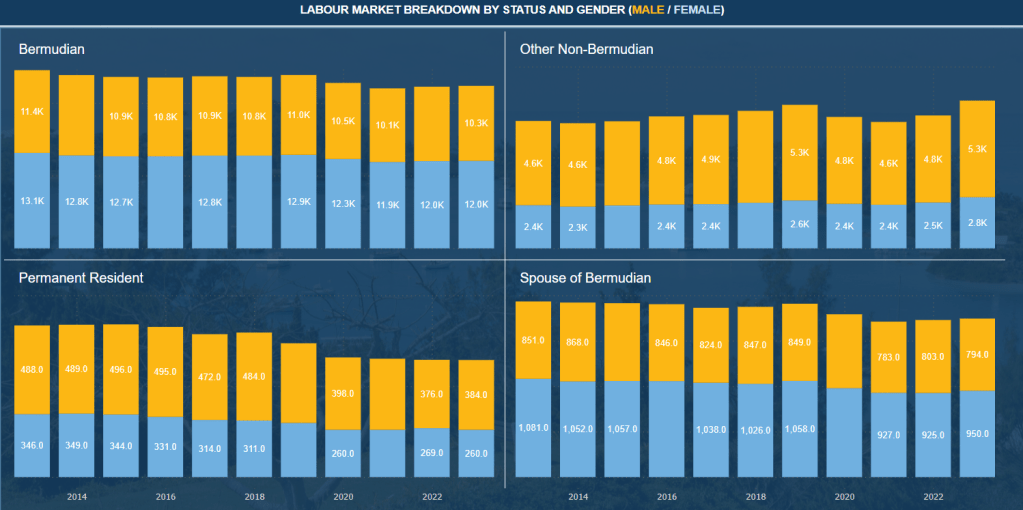
As per the analysis on the Workforce Over Time, the overall workforce has been recovering since a substantial drop in 2020. The status breakdown helps to see the overall trends, with only ‘Other non-Bermudian’ seeing strong growth.
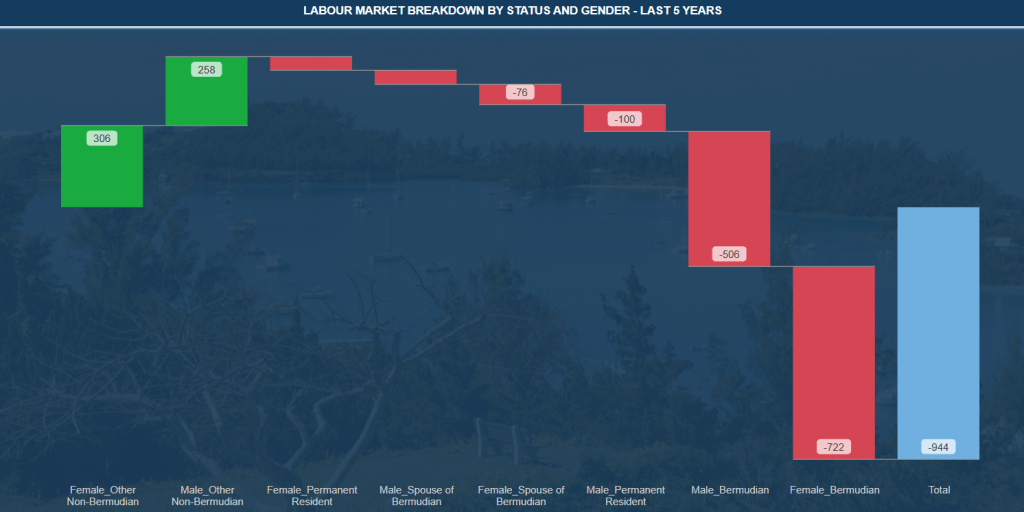
All of the ‘local’ statuses – Bermudians, Spouses of Bermudians and PRC holders – have seen declines in the past 5 years.
In the absence of census data – which we hope will be conducted in 2026 – this has worrying implications for the greater population on the island. While it likely a mix, this implies fewer residents on the island – a larger number of non-Bermudians and likely significantly more unemployed Bermudians.