The data available in the Government Digest of Statistics enables us to review over 20 years of revenue and spend by the public sector.
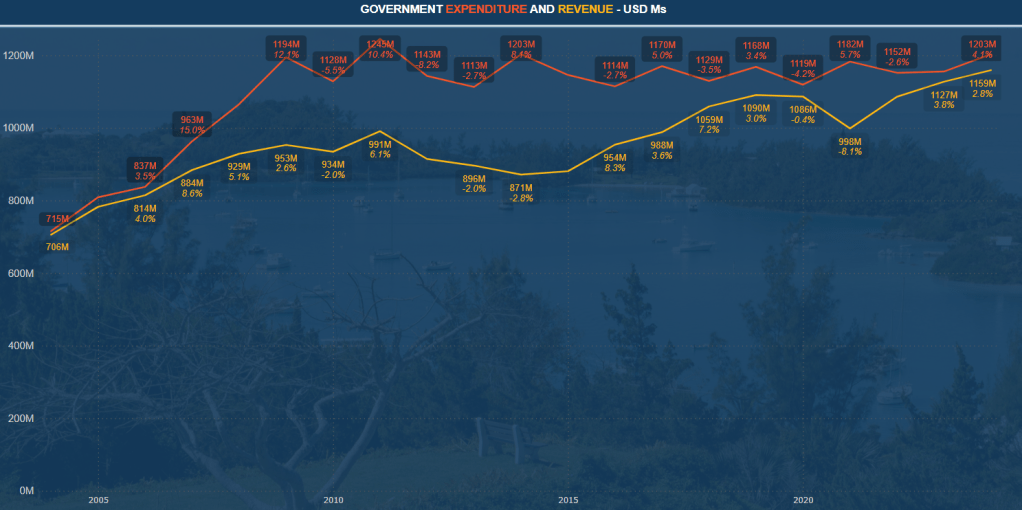
Unlike expenditure – which rose quickly in the mid 00’s funded by debt, revenue has had a more steady increase over time. It is up nearly 50% across 20 years, and saw significant increases from 2016 – with a dip in 2021 being the only decrease in recent times. It is up c. 30% in the last 10 years, and 6% in the last 5.
Importantly, this is closing the deficit to a much more manageable gap – though no surplus has been seen in the entire data set.
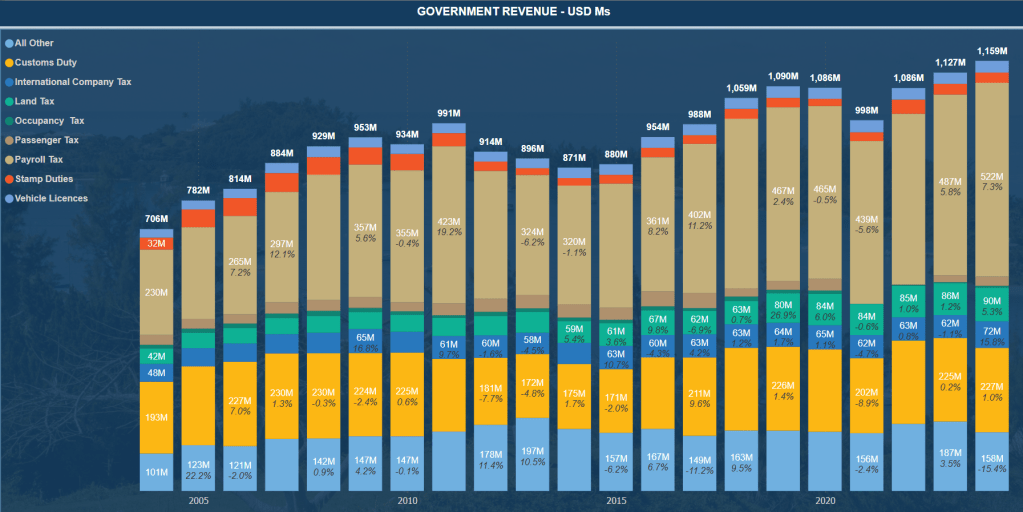
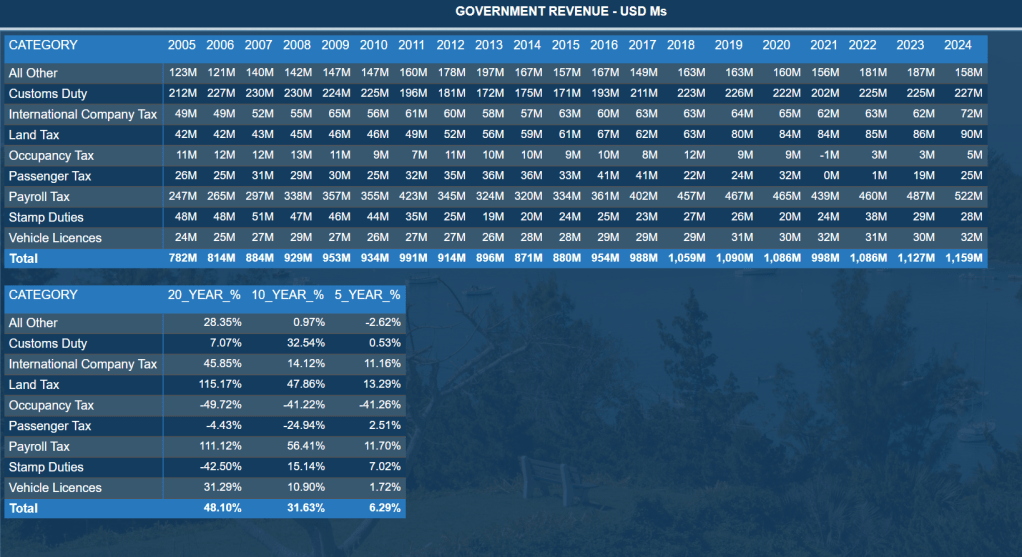
The majority of this increase has been funded by taxation. Both Land Tax and Payroll Tax are up more than 100% in the last 20 years – the latter is particularly notable as there are fewer employees in 2024 than in 2005: the tax per employee has risen significantly. Payroll tax was responsible for some 30% of total revenue in 2005, this was over 45% in 2024.
The revenue driven by tourism has remained far more flat over time, with the combination of Occupancy Tax + Passenger Tax representing 5% in 2005, halving to 2.5% in 2024.
Interestingly, Customs Duty has remained fairly flat over time, despite increases to inflation globally.

Leave a comment